

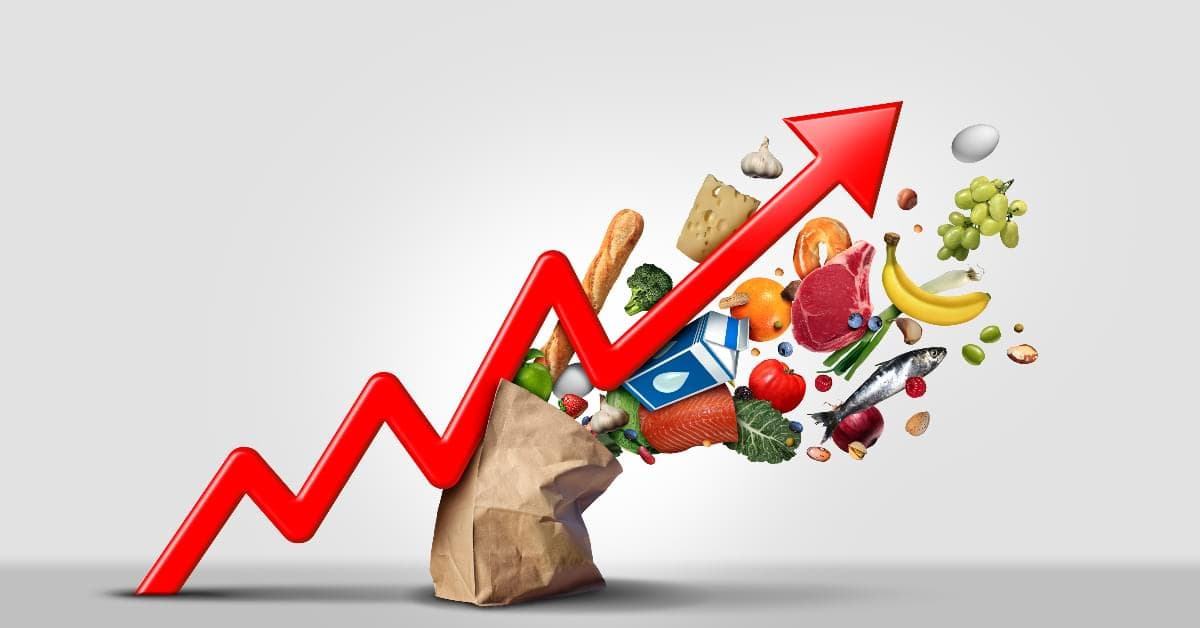
A print of 1.54% is the lowest retail inflation in more than eight years. Numbers this low invite questions: what exactly is being measured, how is it compiled, and which macro indicators matter for the policy path ahead? Here’s a clean explainer of the terms you’ll see in every inflation debate.
What is inflation (and what it isn’t)
Inflation is the rate of increase in the general price level over a period of time. If September’s index was 100 last year and 101.54 now, the year-on-year (y/y) inflation is 1.54%.
-
Headline inflation: the full basket (food, fuel, everything).
-
Core inflation: headline minus volatile food and fuel; useful for gauging persistent price pressures.
-
Disinflation: price growth slows (from 5% to 2%).
-
Deflation: prices fall year-on-year (negative inflation).
-
Base effect: a high or low reading a year ago mechanically pushes this year’s percentage up or down.
CPI vs WPI — two different lenses
CPI (Consumer Price Index)
-
What it captures: the prices households pay. It is the RBI’s policy target.
-
Who compiles: National Statistical Office (NSO) in the Ministry of Statistics & Programme Implementation (MoSPI).
-
Coverage: rural and urban markets across India; weights reflect a typical household’s spending (food has a large weight).
-
Use case: cost of living, indexation, monetary policy.
WPI (Wholesale Price Index)
-
What it captures: average change in prices of goods at the wholesale/producer level (commodities, manufactured products, fuel).
-
Who compiles: DPIIT, Ministry of Commerce & Industry.
-
Coverage: ex-factory/first-sale prices of goods; limited services.
-
Use case: producer margins, input cost trends, contract escalation.
Why can CPI and WPI diverge? Food weights differ, services are big in CPI but minimal in WPI, and taxes/margins between factory gate and retail can widen or narrow. A fall in global crude may cool WPI first; CPI may follow with a lag.
MoSPI (and how the CPI is built)
MoSPI houses the NSO, which designs the basket, samples outlets, collects prices, and publishes the CPI each month. It also releases GDP, IIP and other core statistics. Important features:
-
Basket & weights: based on consumption surveys; food has the highest weight in India’s CPI, so monsoon patterns matter.
-
Indices: All-India CPI, plus Rural, Urban and State-wise prints.
-
Variants you may see: CPI-IW (industrial workers) for wage indexation, CPI-AL/RL (agricultural/rural labourers).
RBI’s target and the policy link
India operates a flexible inflation-targeting regime: 4% CPI as the midpoint, with a 2–6% tolerance band. The Monetary Policy Committee (MPC) uses interest rates, liquidity and communication to steer inflation toward 4% over time.
-
A print below 2% raises questions about growth momentum, output gaps and whether policy can ease without rekindling prices.
-
The MPC also monitors inflation expectations, fiscal impulses, and global commodity trends.
NEER and REER — the currency–inflation bridge
-
NEER (Nominal Effective Exchange Rate): a trade-weighted index of the rupee against partner currencies, without adjusting for inflation.
-
REER (Real Effective Exchange Rate): NEER adjusted for inflation differentials. If India’s inflation is higher than partners’, REER tends to appreciate even if NEER is flat—implicating competitiveness.
Why they matter for prices: A stronger rupee (higher NEER/REER) can cheapen imports (oil, edible oils, fertilizers), damping CPI; a weaker rupee can raise imported inflation.
Other concepts you’ll hear in the same breath
-
Imported vs domestic inflation: global oil, pulses, edible oils, and shipping costs feed into CPI via imports.
-
Terms of trade: relative prices of exports vs imports; can affect farm incomes and headline inflation.
-
GDP deflator: ratio of nominal to real GDP; a broad price gauge across the whole economy (goods + services), not just a fixed consumer basket.
-
Output gap: difference between actual and potential GDP; a negative gap tends to cool core inflation, a positive gap can heat it.
-
Sticky vs flexible prices: services and housing are stickier; vegetables and fuel are flexible and swingy.
-
Seasonality: many food items have predictable seasonal spikes; analysts seasonally adjust to see underlying trends.
Reading the latest print like an economist
-
Food & beverages contracted year-on-year, helped by base effects and a good monsoon; watch for late-season rain-damage risks.
-
Fuel & light softened, reflecting past global energy trends and tax pass-throughs.
-
Edible oils show persistence; global prices and import dependence keep this sub-index a risk area.
-
Housing and some services remained firm, reminding that core pressures don’t vanish just because headline is low.
Implications: policy and markets
-
A run of sub-2% CPI readings strengthens the case for an MPC rate cut if the outlook stays benign; but committees often wait for confirmation to avoid a whipsaw.
-
Bond markets may price earlier easing; FX will watch REER/NEER and oil.
-
For households, softer food and fuel inflation temporarily boosts real purchasing power; for firms, lower input costs can improve margins—unless weak pricing power signals soft demand.
Bottom line
CPI’s slide to 1.54% is not just a number; it’s a composite of base effects, food/fuel swings, and a currency channel that shows up through NEER/REER. Understanding what each index measures, who compiles it, and how it links to policy is the difference between chasing headlines and reading the macro story.
Source: The Hindu